 Swing trading indicators can come along and change the whole game as they ease the process but also provide many false signals. Such a double-edged benefit of technical tools makes many swing traders hesitate about whether they should use these indicators. This article offers an exclusive overview of the common technical indicators for swing trading. So, you can learn how to leverage their superior functions to help you earn higher profits from swing trading. What’s Swing Trading and How Does It Work?Swing trading indicators a type of fundamental trading where you can hold positions longer than a single day. Technical analysis plays an important role in the development and modification of swing trading strategies. The Importance of Understanding Swing Trading Indicators What are Swing Trading Indicators and it important? There are three aspects of a trade that you should take into consideration, trends, momentum, and volume. Thus, the help of tools in such areas can help you profitably swing trade no matter how volatile the market is.
Top Swing Trading Indicators Best Leading Indicators for Swing Trading Moving Averages (MAs)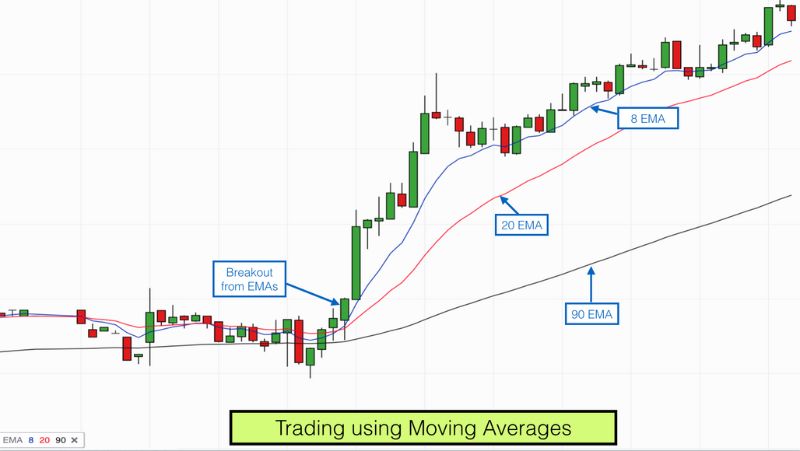 Moving averages are often used in Swing Trading Indicators. Moving averages (MAs) are a stock indicator that you typically find in technical analysis. This tool can mitigate short-term fluctuations in stock prices over a specified time frame. So, the price data becomes much more understandable and generates more valuable insights. VolumeVolume is also a technical analysis tool that many swing traders use to better analyze the strength of a new trend – whether it can last or not amidst multiple influential factors. The underlying principle is simple: if a trend comes along with a high volume, it shows much more strength than the trend with a weak volume. Ease of Movement (EOM or EMV)Ease of Movement indicator clarifies the relationship between price and volume so that the strength of an underlying trend can be under the spotlight. Simply put, the tool helps swing traders determine whether prices can rise, or fall, with little resistance in certain movement directions. Relative Strength Index (RSI)Relative strength index is helpful to determine whether a stock’s price is strong or not. So, it is among the crucial momentum indicators in technical analysis. Specifically, it gauges the speed and magnitude of an asset’s recent price changes to assess overvalued or undervalued conditions. Stochastic OscillatorStochastic oscillator is an indicator that has the same operating system as the RSI. It indicates the market movements through the comparison of the closing price of a market to the range of its prices in a specific period. The difference between a stochastic oscillator with RSI is the inclusion of two lines – one indicates the current value of the oscillator, and another line shows a three-day moving average (MA). MACDMACD stands for Moving Average Convergence Divergence. This trend-following momentum indicator points out the relationship between two moving averages of an underlying asset’s price. You can get the result of MACD by subtracting the 26-period EMA from the 12-period EMA. Bollinger BandA Bollinger band, a technical analysis tool, entails a group of trendlines with two standard deviations. These deviations are apart from a simple moving average (SMA) of an asset’s price. A well-known technical trader, John Bollinger, was the man behind this tool. He developed this tool to uncover the opportunities that enable swing traders and investors to accurately identify the timing of an overbought/oversold asset. Bullish Candlestick Reversal PatternsThere are five powerful patterns that showcase bullish candlestick reversals, such as hammer, piercing, bullish engulfing, morning star, and three white soldiers.
Other Indicators used for Swing TradingSupport and ResistanceSupport and resistance refer to areas on a market’s chart with challenges of crossing. They create the basis of main technical strategies for many trading types, and swing trading is no exception. PatternsThere are many swing trading patterns that you can use as hints for potential uptrends and reversals.
How to Start Using Swing Trading IndicatorsThese tools will be a great help for swing traders to identify the timing and methods of opening trade or position. You can find optimal entry points with the aid of the signals that the superior features of these tools can offer. Why Should use Swing Trading IndicatorsThe swing trading indicators that we introduce in this article are the basic tools that many swing traders have used to better their trades. You can see those indicators showcase three primary dimensions of a trade, including trend strength, momentum, and volumes.
Article Source: https://libraryoftrader.net/swing-trading-indicators
0 Comments
Leave a Reply. |
Library Of TraderLibrary of Trader is a Group Buying platform specializing in providing Trading, Investing, and Cryptocurrency online courses. Website: https://libraryoftrader.net/ ArchivesCategories |
 RSS Feed
